
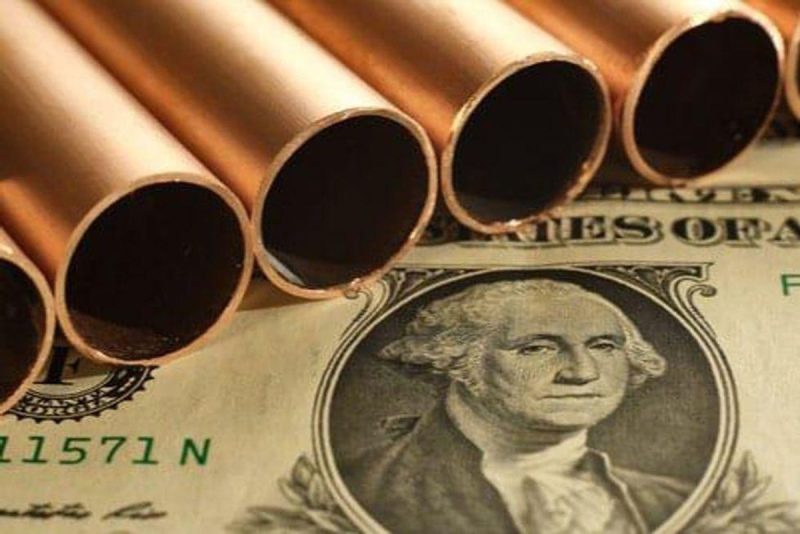
Strong demand in the face of looming supply shortages has pushed copper to new heights in recent years.
With a wide range of applications in nearly every sector, copper is by far the most industrious of the base metals. In fact, for decades, the copper price has been a key indicator of global economic health, earning the red metal the moniker “Dr. Copper.” Rising prices tend to signal a strong global economy, while a significant longer-term drop in the price of copper is often a symptom of economic instability.
After bottoming out at US$2.17 per pound in mid-March 2020, copper has largely been on an upward trajectory.
Higher copper prices in 2021 and 2022 were attributed to a widening supply/demand gap. The already tenuous copper supply picture was made worse by COVID-19 lockdowns, and as the world’s largest economies seemingly began to emerge from the pandemic, demand for the metal picked up once again. Copper-mining and refining activities simply couldn’t keep up with the rebound in economic activity.
What key factors drive the price of copper?
Robust demand has long been one of the strongest factors driving copper prices. The ever-growing number of copper uses in everyday life — from building construction and electrical grids to electronic products and home appliances — make it the world’s third most-consumed metal.
Copper’s anti-corrosive and highly conductive properties are why it’s the go-to metal for the construction industry (for example, in copper pipes and copper wiring). In fact, construction is responsible for nearly half of global copper consumption. Rising demand for new homes and home renovations in both Asian and western economies is expected to support copper prices in the long term.
In recent decades, copper price spikes have been strongly tied to rising demand from China as the economic powerhouse injects government-backed funding into new housing and infrastructure. Industrial production and construction activity in the Asian nation have been like rocket fuel for copper prices.
Additionally, copper’s conductive properties are increasingly being sought after for use in renewable energy applications, including thermal, hydro, wind and solar energy.
However, the biggest driver of copper consumption in the renewable energy sector is rising global demand for electric vehicles (EVs), EV charging infrastructure and energy storage applications. As governments push forward with transportation network electrification and energy storage initiatives as a means to combat climate change, copper demand from this segment is expected to surge.
Europe’s copper demand is growing alongside its renewable energy sector. In 2023, battery electric vehicle sales in the region increased by 15 percent over 2022 for the year to come in at about 3.3 million units sold, and analysts expect that trend to continue in the coming years. While internal combustion engine vehicles only use about 22 kilograms of copper, hybrid EVs use 40 kilograms, plug-in hybrid EVs use 55 kilograms, battery EVs use 80 kilograms and battery electric buses use 253 kilograms.
On the supply side of the copper market, the world’s largest copper mines are facing depleting high-grade copper resources, while over the last decade or more new copper discoveries have become few and far between.
The pandemic made the situation worse as mining activities in several top copper-producing countries faced work stoppages and copper companies delayed investments in further exploration and development — a challenging problem considering it can take as many as 10 to 20 years to move a project from discovery to production. In addition, delayed investments amid the pandemic will also have long-term repercussions for copper supply.
Analysts at Rystad Energy project that copper demand will outstrip supply by more than 6 million metric tons by 2030. “A deficit of this magnitude would have wide-reaching ramifications for the energy transition as there is currently no substitute for copper in electrical applications,” they said in a note. ‘Significant investment in copper mining is required to avoid the shortfall.”
This is largely due to ongoing production issues at major copper mines, most notably the shutdown of First Quantum Minerals’ (TSX:FM,OTC Pink:FQVLF) Cobre Panama mine, which accounted for about 350,000 MT of the world’s annual copper production.
This means end users may need to turn to the copper scrap market to make up for the supply shortage. Sometimes referred to as “the world’s largest copper mine,” recycled copper scrap contributes significantly to supplying and balancing the copper market.
How has the copper price moved historically?
Taking a look back at historical price action, the copper price has had a wild ride for more than two decades.
Sitting at a low of US$0.73 per pound in early June 2001, the copper price followed global economic growth up to a high of US$3.91 in April 2008. Of course, the global economic crisis of 2008 soon led to a copper crash that left the metal at only US$1.29 by the end of year.
Once the global economy began to recover in 2011, copper prices posted a new record high of US$4.58 at the start of the year. However, this high was short-lived as the copper price began a five year downward trend, bottoming out at around US$1.95 in early 2016.
Copper prices stayed fairly flat over the next four years, moving in a range of US$2.50 to US$3.
25 year copper price performance
Chart via Trading Economics
The pandemic’s impact on mine supply and refined copper in 2020 pushed prices higher despite the economic slowdown. The copper price climbed from a low of US$2.17 in March to close out the year at US$3.52.
In 2021, signs of economic recovery and supercharged interest in EVs and renewable energy pushed the price of copper to rally higher and higher. Copper topped US$4.90 per pound for the first time ever on May 10, 2021, before falling back to close at US$4.76.
Also affecting the copper price at that time was expectations for higher copper demand amid supply concerns out of two of the world’s major copper producers: Chile and Peru. In late April 2021, port workers in Chile called for a strike, while in Peru presidential candidate Pedro Castillo proposed nationalizing mining and redrafting the country’s constitution.
In early May 2021, news broke that copper inventories were at their lowest point in 15 years. Expert market watchers such as Bank of America commodity strategist Michael Widmer warned that further inventory declines into 2022 could lead to a copper market deficit.
In early 2022, the copper price continued to spike on economic recovery expectations and supply shortages to reach its current all-time high.
So what exactly was the highest price for copper?
Why did the copper price hit a record high in 2022?
The price of copper reached its highest recorded price of US$5.02 per pound on March 6, 2022. How did it get there? The metal started out the year at US$4.52. Throughout the first quarter of 2022, fears of supply chain disruptions and historically low stockpiles amid rising copper demand drove prices higher.
However, copper prices pulled back in mid-2022 on worries that further COVID-19 lockdowns in China, as well as a growing mortgage crisis, would slow down construction and infrastructure activity in the Asian nation. Rising inflation and interest hikes by the Fed also placed downward pressure on a wide basket of commodities, including copper. By late July 2022, copper prices were trading down at nearly a two year low of around US$3.30.
In the early months of 2023 the copper price had received a helpful boost from continuing concerns about low copper inventories, signs of rebounding demand from China, and news about the closure of Peru’s Las Bambas mine, which accounts for 2 percent of global copper production.
However, that boost turned to a bust in the second half of 2023 as China continued to experience real estate sector issues, alongside the economic woes of the rest of the world.
Copper’s rally in recent years has encouraged bullish sentiment on prices looking ahead. In the longer term, the fundamentals for copper are expected to get tighter as demand from sectors such as EVs and energy storage increases, and as governments around the world push for green energy transitions.
By 2031, McKinsey expects demand from power generation, EVs and electronic devices to push the copper supply deficit to 6.5 million MT. Looking over to renewable energy, according to the Copper Development Association, solar installations require about 5.5 MT of copper for every megawatt, while onshore wind turbines require 3.52 MT of copper and offshore wind turbines require 9.56 MT of copper.
Where can investors look for copper opportunities?
Copper market fundamentals suggest a return to strength in the long term. The copper supply/demand imbalance also presents an investment opportunity for those interested in copper-mining stocks.
Securities Disclosure: I, Melissa Pistilli, hold no direct investment interest in any company mentioned in this article.